

Sunofix Lab
Audio to Spectrogram: What the Image Shows and What It Cannot
Convert WAV or MP3 audio to a 1920×840 spectrogram PNG. Follow the free browser workflow, read time and frequency, and check clipping clues by listening.
Sunofix Lab
First-party methods for level-matched A/B listening, representative test segments, spectrogram checks, device comparisons, and regression review—without exposing private implementation.
Listening map
Curated path
Move from diagnosis to action in sequence. Each guide answers a different decision instead of repeating the same cleanup advice.
Category library
Convert WAV or MP3 audio to a 1920×840 spectrogram PNG. Follow the free browser workflow, read time and frequency, and check clipping clues by listening.
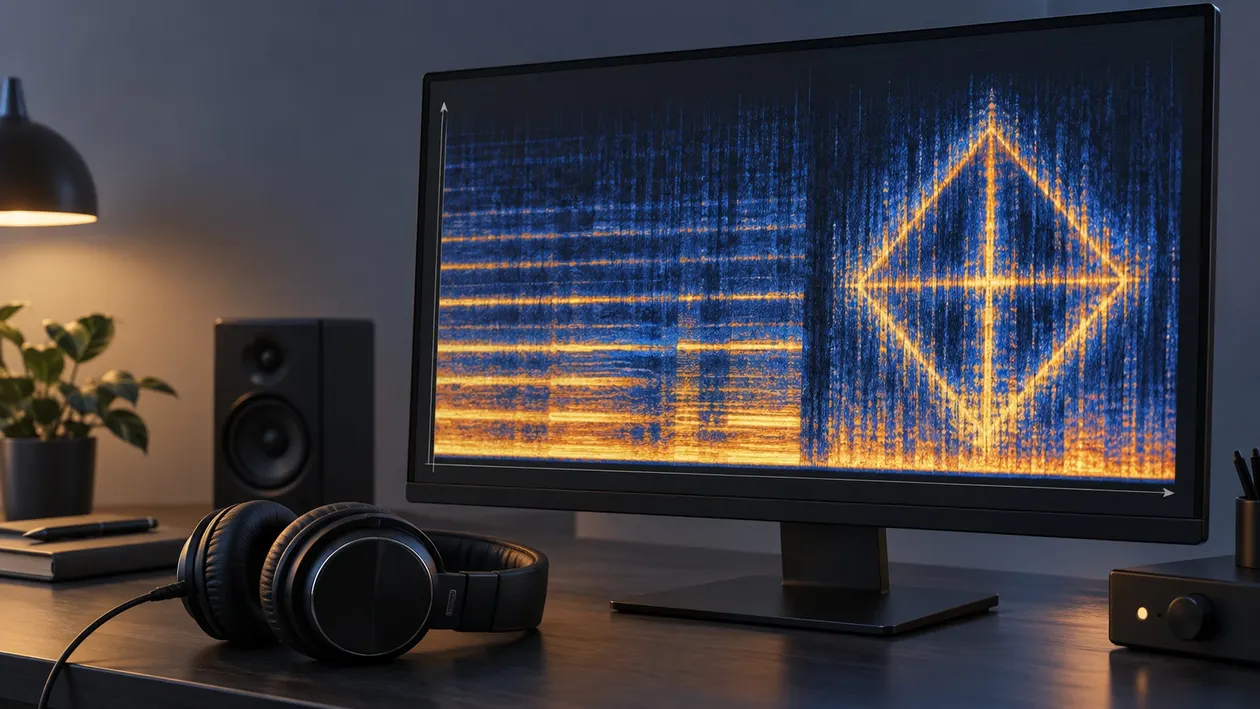
Find hidden text and pictures in WAV or MP3 audio, compare spectrogram settings, and learn where browser viewers help—and where manual inspection is needed.
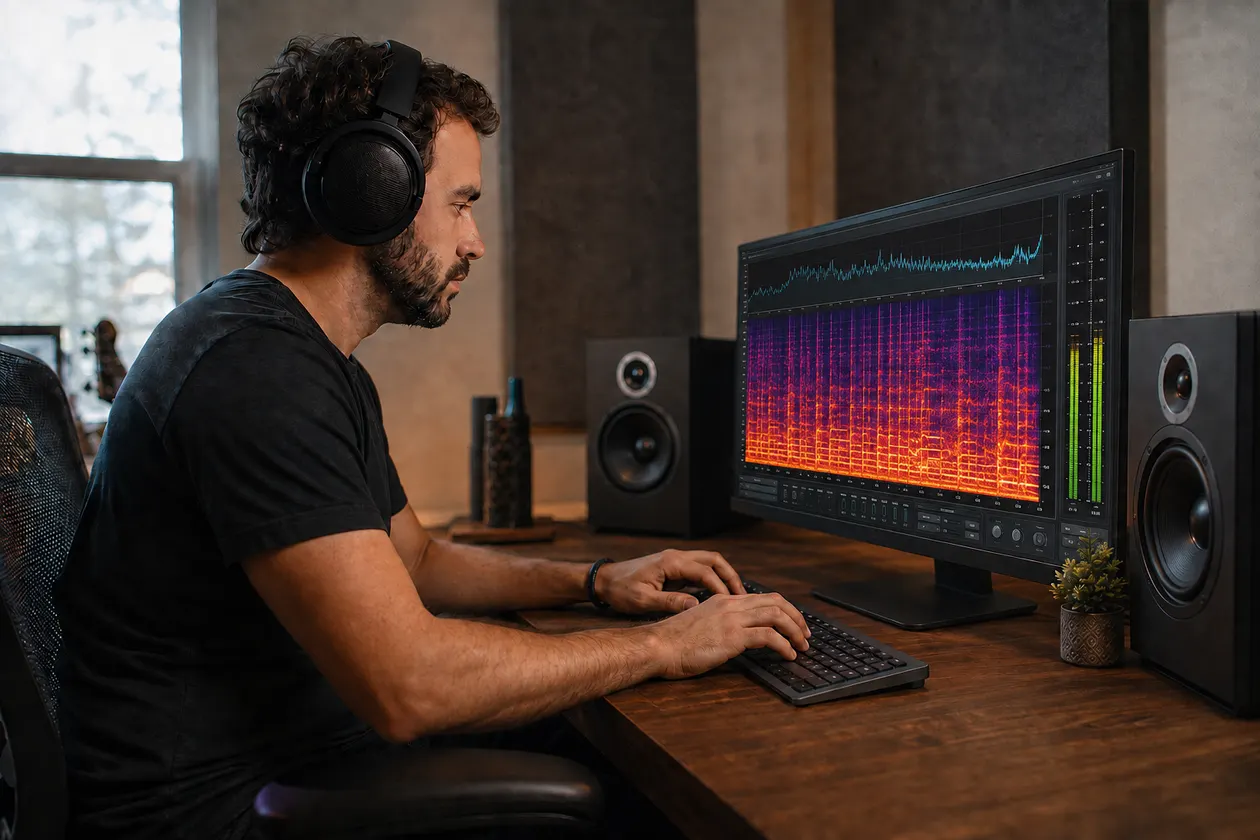
Compare original and processed audio fairly by matching the source, spectrogram settings, playback level, listening passage, and decision criteria.
Avoid ten common spectrogram interpretation mistakes involving settings, color, loudness, codecs, screenshots, and listening confirmation.
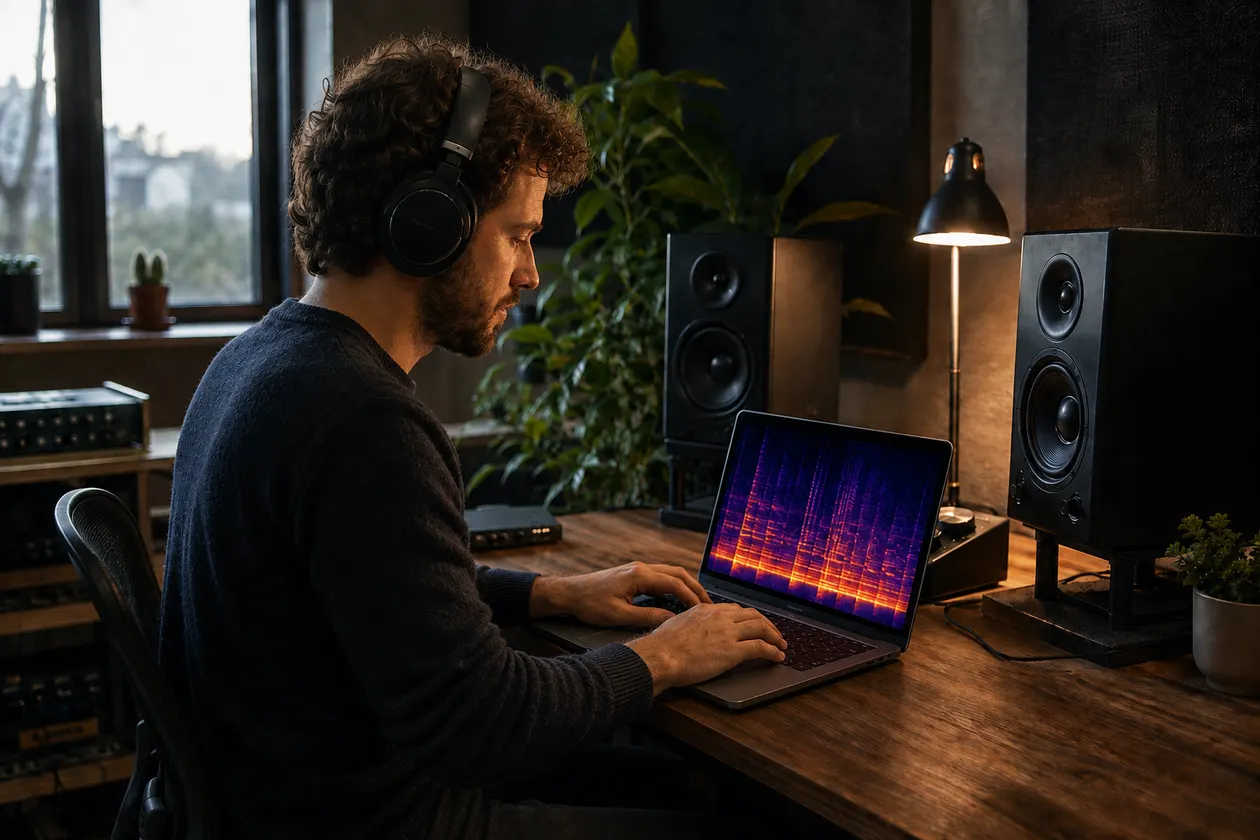
Choose between a spectrogram and a spectrum analyzer by matching the view to the sound: moving artifacts over time or steady frequency balance in one passage.
Learn why window size, scale, normalization, color, and display dimensions can change a spectrogram, plus a repeatable method for comparing the same audio fairly.
Learn a practical level-matched A/B test for audio cleanup, with rapid switching, a difficult chorus, playback checks, and a clear stop criterion.
Learn which waveform and spectrogram clues can support a clipping or over-compression check, which patterns mislead, and how to confirm the problem by listening.
Learn what time, frequency, and color show in a music spectrogram, which visual patterns deserve a listen, and which conclusions the picture cannot support.
Learn how to read time, Hz, kHz, and relative color in an audio spectrogram, why resolution changes the picture, and how to confirm every visual clue by listening.
Learn what can change when you compare WAV, MP3, and FLAC spectrograms, which differences matter, and which conclusions the image cannot support.
Change the question
Work on the source
Start with the best export available, compare at the same listening level, and keep the cleanup only when it serves the song.
Try Sunofix with 1 free credit