
Spectrogram vs Spectrum Analyzer: Which View Do You Need?
Choose between a spectrogram and a spectrum analyzer by matching the view to the sound: moving artifacts over time or steady frequency balance in one passage.
Choose the right view, then listen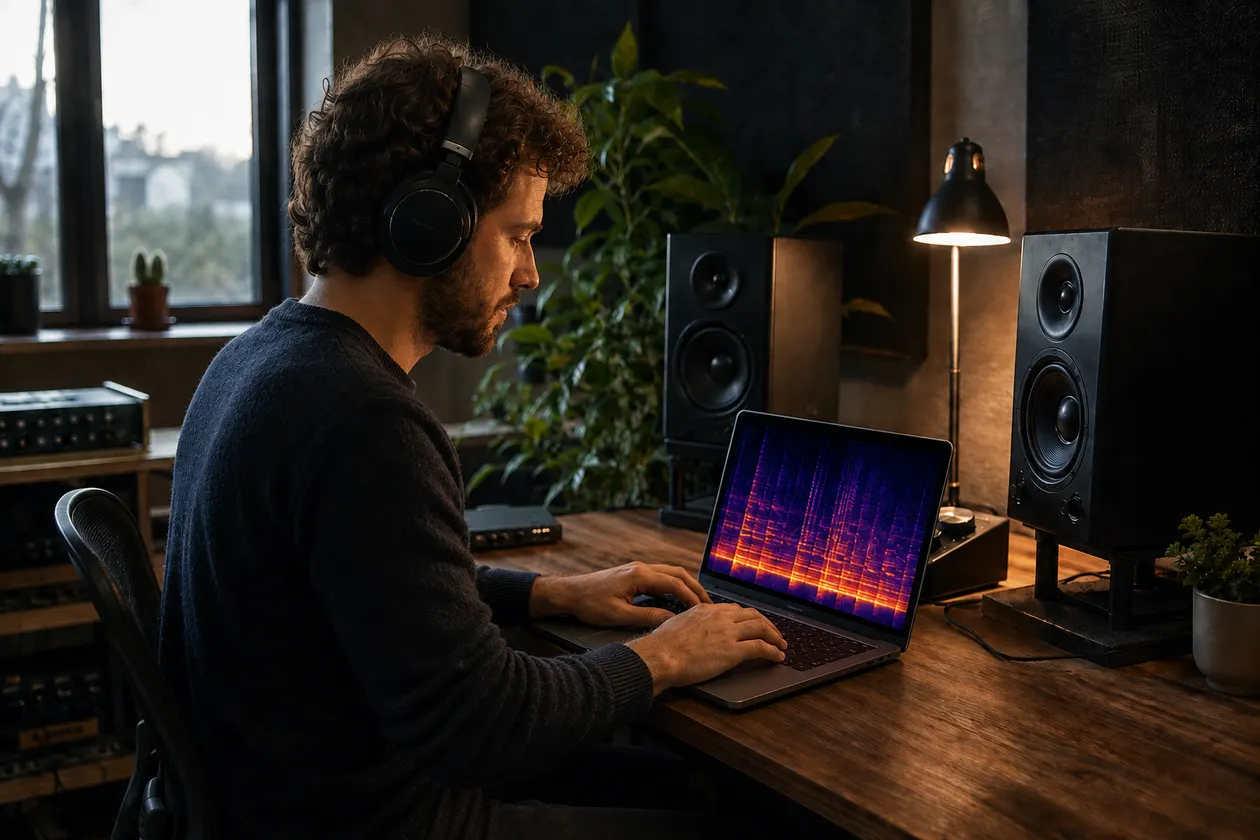
Use a spectrogram when the question contains time: When does that metallic trail appear, and what does it follow? Use a spectrum analyzer when the question is about the frequency balance of one moment or selection: Is this chorus consistently heavy in the low mids or sharp in the upper mids? Neither view judges the music for you. Pick the display that exposes the behavior you are trying to hear, mark a short passage, and confirm it by listening.
The practical rule is simple. If the problem moves, flickers, repeats, or changes between sections, start with a spectrogram. If it stays fairly steady and you want to compare broad tonal shape or a persistent peak, start with a spectrum analyzer. The limit comes first too: both displays depend on FFT size, windowing, scale, averaging, and level. A striking picture can come from the settings rather than the track.
I start with the ears because the screen has no idea which part of the song matters to you. I write down a plain description such as “thin glassy trail after the vocal” or “chorus gets tiring but the verse does not,” then open the view that can test that description.
Time-frequency view
A spectrogram shows frequency energy across time. Time runs from left to right, frequency runs from bottom to top, and color represents measured level under the current display settings. Audacity describes its Spectrogram View in the same practical terms: energy in frequency bands changes over time, which makes sudden onsets, clicks, and alignment points easier to locate.
Most music spectrograms use a short-time Fourier transform, or STFT. The software divides the signal into overlapping slices and calculates a spectrum for each slice. SciPy’s ShortTimeFFT documentation exposes the window, hop, sample rate, FFT length, scaling, time positions, and frequency bins behind that process. Stack those spectra in time order and you get a time-frequency map rather than one frequency curve.
That retained history is the reason to choose a spectrogram for events. A click may form a narrow vertical mark. A whistle or steady tone can form a horizontal line. A reverb tail extends after the source sound. A texture that follows only held vowels may appear in different places from a noise bed that continues between phrases. These shapes tell you where to replay; they do not tell you what made the sound.
Resolution matters. A longer window separates nearby steady frequencies more clearly but spreads quick changes over time. A shorter window places fast events more precisely but groups nearby frequencies into wider bands. Changing window type, overlap, color range, or frequency scale can also change the picture. Record the settings when you compare two files or two tools.
The browser spectrogram generator offers a consistent way to create a PNG from one local MP3 or WAV in browser memory. It is useful when your job is to find a time and frequency region worth replaying. It does not clean the file, transfer it to the Sunofix app, or turn a visual pattern into an automatic diagnosis.
Aggregate spectrum view
A spectrum analyzer gives frequency on one axis and level on the other. It may display the current analysis frame in real time, hold peaks, or average data over a selected passage. The time history is no longer the main coordinate. You see a curve or set of bars that makes the frequency distribution easier to inspect at that moment or across that average.
Audacity’s Plot Spectrum takes the selected audio, processes it in blocks with an FFT, and averages the blocks together. That is useful when you care about the selection as a whole. A sustained resonance can remain visible instead of being scattered across a long timeline, and a broad tilt can be easier to compare between a verse and chorus.
A real-time analyzer behaves differently from an offline average. The Web Audio API’s AnalyserNode, for example, supplies current frequency data and includes a smoothing setting that blends the latest frame with earlier analysis. A fast, unsmoothed display jumps with drums and consonants. More smoothing makes the curve calmer but can hide brief changes. Peak hold, averaging time, FFT size, and decay all affect what stays on screen.
Use one analyzer configuration when comparing passages. Match the channel choice, selection length, playback level, FFT size, smoothing or averaging, frequency scale, and vertical range. A louder input raises much of the curve. A longer average gives sustained material more influence than one short transient. If the settings differ, the shapes are not a controlled comparison.
The aggregate view is efficient, but it gives up context. A peak does not tell you whether it came from a wanted snare hit, one sharp vowel, a synth note, or a problem that lasted through the whole chorus. Return to the timeline or loop a shorter selection whenever the average mixes unrelated events together.
Moving artifacts
Choose the spectrogram first when the unwanted sound changes with the music. Metallic shimmer may appear on held vocals, splashy cymbals may spread after each hit, and a smeared reverb tail may continue into the next phrase. A single averaged spectrum can show that upper-frequency energy exists, but it can blur the difference between the source, the tail, and the silence around it.
Start by listening without watching. Mark the first and last moment of the sound. Then open the spectrogram and find the same seconds. Ask whether the visible feature begins and ends with the sound you described. Repeat the check in another phrase. A pattern that survives two listening checks is more useful than one unusual-looking patch.
Follow movement rather than brightness. Does the texture climb with the melody? Does it appear only when the vocal and cymbals overlap? Does it continue through a pause? Does it become wider in the busiest chorus? Those questions lead to different manual tests. A moving narrow problem may call for automation or dynamic processing, while a steady noise floor may respond to cautious denoise. The picture only helps you choose what to test.
I usually check the busiest chorus first. That is where upper-frequency textures stop hiding behind the arrangement, but it is also where wanted cymbal energy, vocal air, and synth harmonics crowd the display. I pair that chorus with one exposed verse or intro so the busy section does not become the only evidence.
If the sound is a harsh upper layer, use the listening steps in how to fix harsh highs in AI music. Try one restrained change on a copy, compare it with the original at a similar perceived level, and stop if consonants lose clarity, cymbals turn papery, or the chorus gets smaller. A darker spectrogram is not a win if the music lost its air.
Steady balance problems
Choose a spectrum analyzer first when the concern is stable across a meaningful passage. Examples include a chorus that feels consistently boomy, a vocal stem with a persistent nasal emphasis, or an entire export that seems tilted toward the top end. The frequency curve makes broad balance and repeated peaks easier to inspect than a dense two-dimensional map.
Select a passage that represents the complaint. Do not average a quiet intro together with a loud chorus and expect one curve to explain both. Compare like with like: chorus against chorus, the same vocal phrase before and after a change, or two versions of the same export. Keep input gain and analyzer settings fixed.
Read broad areas before narrow spikes. A low-mid rise across a wide band can support the impression of mud, while one needle-like peak may belong to a note that lasts only a fraction of the selection. Narrow peaks also move when the melody changes. Loop the passage and watch whether the feature stays put before reaching for EQ.
A spectrum analyzer is helpful for choosing a manual EQ test because it can show where a persistent imbalance sits. Make a small cut, bypass it often, and listen away from the screen. If the track becomes thinner before the complaint improves, undo the move. The analyzer can aim the test; it cannot decide the acceptable trade.
The same caution applies to metallic sound. A stable bright balance is not the same problem as a moving synthetic layer. The metallic-sound diagnosis guide separates steady hiss, broad harshness, resonant ringing, and texture that follows vocals or reverb. If a static EQ cut removes wanted presence while the metallic trail remains, switch back to a time-frequency view and inspect how the problem moves.
Tool-selection table
Use the question, not the most impressive display, to choose your first view.
| Question | Start with | Why |
|---|---|---|
| When does a click, splash, or metallic tail appear? | Spectrogram | It keeps the time position and shows how frequency energy changes around the event. |
| Does a texture follow the vocal, cymbal, or reverb tail? | Spectrogram | Movement and duration remain visible instead of being folded into one average. |
| Is this chorus broadly bass-heavy, nasal, or bright? | Spectrum analyzer | A curve makes steady tonal shape across one controlled passage easier to inspect. |
| Is one resonance persistent through the selection? | Spectrum analyzer, then spectrogram | The analyzer locates the area; the spectrogram checks whether it stays steady or belongs to separate events. |
| Did cleanup change a named event over time? | Spectrogram | Matched before-and-after maps can point to the same seconds for listening. |
| Did EQ change the overall balance of the same passage? | Spectrum analyzer | Fixed settings make broad reductions and additions easier to compare. |
| Do I need to know whether a visible feature is unwanted? | Listening | Neither visual view knows the artistic intent or acceptable cost. |
A practical workflow uses both views without forcing every decision through both. First, name the sound and choose the display that matches its behavior. Second, isolate one short passage. Third, note the settings and compare at a similar playback level. Fourth, make one small manual change on a copy. Finally, listen to the whole phrase and one contrasting section before keeping it.
When the behavior is unclear, start with the spectrogram because it preserves more context. Use the spectrum analyzer on a short selection after you find the event. When the complaint is clearly steady, start with the analyzer and open the spectrogram only if the average hides when the peak occurs.
Limits and listening confirmation
Both views measure the file under chosen settings. Neither view knows whether a bright band is a cymbal, a consonant, a synth harmonic, hiss, reverb, or an unwanted artifact. Neither can establish the track’s origin, reveal a closed generator’s internal process, or prove why a texture exists. Musical content, effects, encoding, resampling, level changes, and display choices can produce similar shapes.
Do not process toward a tidy graph. A flatter spectrum is not automatically a better mix, because music is not supposed to contain equal energy at every frequency. A darker spectrogram can mean less unwanted shimmer or less wanted air. A smoother real-time trace may come from stronger averaging rather than a steadier recording.
Use this listening confirmation before accepting a change:
- Describe one audible problem without naming a plugin or visual shape.
- Mark the exact passage and choose the view that matches moving or steady behavior.
- Keep file, passage, channel, input level, FFT size, scale, and averaging or display range consistent.
- Identify one visible feature, then replay its time at a comfortable level.
- Make one restrained change on a copy and match perceived loudness before switching.
- Check the intended benefit and the nearest wanted details: diction, cymbal decay, punch, bass weight, depth, and ambience.
- Listen to the full phrase, the busiest section, and one exposed section.
- Stop when the named problem is less distracting and the song still feels intact.
I built Sunofix for the stage where the song already works but a finished export still has a broad synthetic edge that is hard to treat with one static move. Sunofix can provide a cleaner WAV, before-and-after playback, spectrogram comparison, and frequency diagnostics. It cannot recover missing source detail, rewrite lyrics or melody, repair an arrangement or performance, rebalance stems inside a finished mix, replace mastering, or guarantee distributor approval.
Choose the right view, then listen if you want to compare a track-aware cleanup pass with the untouched export. Keep the result only when the audible improvement survives level matching and the parts you wanted to preserve still sound like the same song.
A good analysis ends with a short, testable note: what you heard, where it happened, which view helped you locate it, what changed, and what stayed intact. If you can describe only the graph, you have not finished the listening test. Close the analyzer, replay the phrase, and let the song make the final call.
Continue listening
Related reading
FAQ
Spectrogram vs Spectrum Analyzer: Which View Do You Need? FAQ
What is the main difference between a spectrogram and a spectrum analyzer?
A spectrogram keeps time in the picture, showing how frequency energy changes from moment to moment. A spectrum analyzer shows frequency level for the current frame or an averaged selection, which makes overall tonal balance easier to inspect but removes or compresses the time history.
Should I use a spectrogram or spectrum analyzer for a moving metallic sound?
Start with a spectrogram because the time axis can show whether the energy follows a vocal, cymbal, or reverb tail. Mark the passage and confirm the sound by listening. The image alone cannot identify its cause or decide whether it is unwanted.
Which view is better for checking too much bass or harsh overall balance?
A spectrum analyzer is often the faster first view for a steady balance question because it makes broad frequency shape and persistent peaks easier to compare. Use the same passage and averaging settings, then confirm at matched playback level.
Can Sunofix replace either analysis view?
No. Sunofix can provide before-and-after playback, spectrogram comparison, frequency diagnostics, and a cleaner WAV for a track-aware cleanup test. You still need to listen, and problems in arrangement, performance, stem balance, or missing source detail may require different work.