
Spectrogram Decoder: How to Find and Read Hidden Messages in Audio
Find hidden text and pictures in WAV or MP3 audio, compare spectrogram settings, and learn where browser viewers help—and where manual inspection is needed.
Open the free spectrogram viewer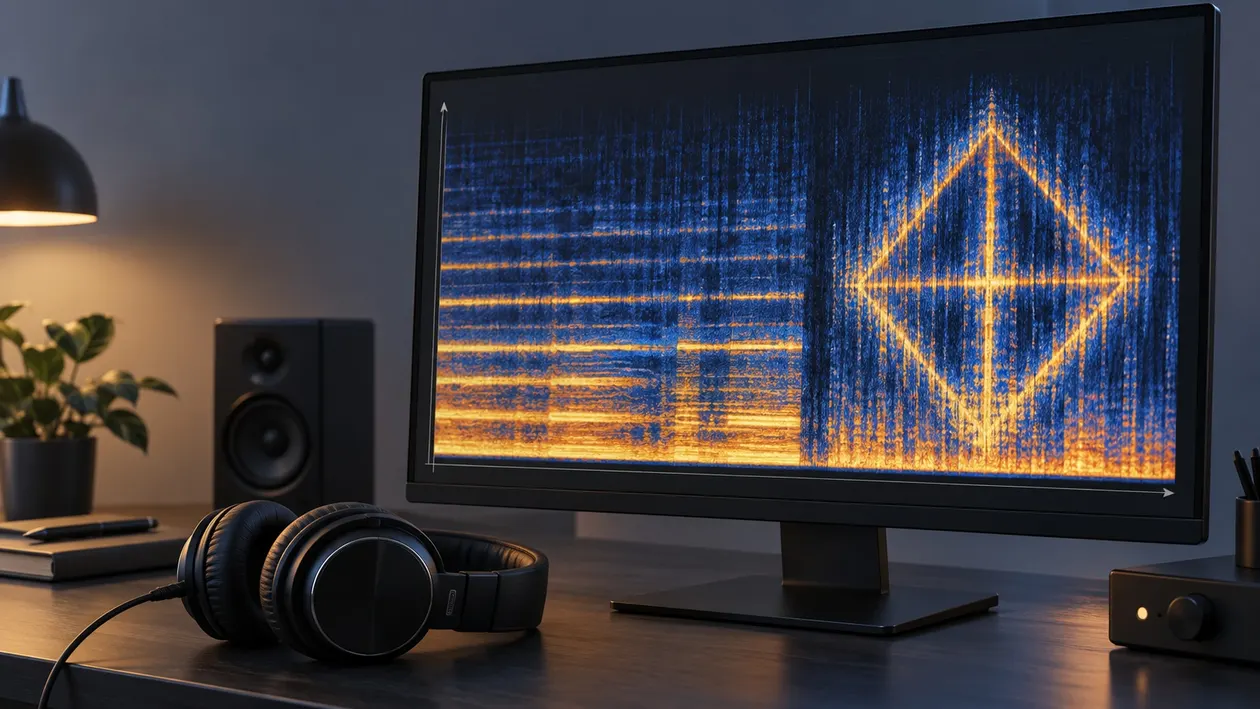
A spectrogram decoder displays audio as a time-frequency image so you can look for deliberately embedded text or pictures. Open the original WAV or MP3 in a spectrogram viewer, inspect the image, and compare the frequency scale and analysis window if a shape is unclear. This is visual inspection: the tool does not automatically decrypt a message or decide what a puzzle means.
Start with the free browser spectrogram viewer if you want a quick first look. If nothing appears, keep the file. A fixed overview can miss a small pattern, and an empty-looking picture is not proof that the audio has no hidden message. The steps below help you decide what to try next without changing the recording.
The cover is an illustrative spectrogram pattern, not a measured result or a screenshot from a commercial recording.
What is a spectrogram decoder and how hidden audio images work
The word “decoder” is often used loosely here. The practical job is to make a frequency picture visible. Read left to right for time, bottom to top for frequency, and use brightness or color for relative signal strength. A normal waveform shows how the overall signal moves; it does not separate the simultaneous frequencies that can form a picture.
Imagine a drawing made from many thin horizontal strokes. Each stroke can correspond to a tone at a particular frequency, played for a particular length of time. Arrange those tones deliberately and the spectral display can show a letter, outline, or face. This does not mean every unusual band is writing. A held note and its harmonics can make regular stripes without carrying any visual message.
There are three different tasks worth keeping straight:
- Viewing: turn an existing recording into a spectrogram and look at it.
- Generating: turn text or an image into tones that draw a pattern when viewed.
- Reconstructing: estimate sound from a spectral representation. A colored screenshot is not a complete original recording.
For an ARG—an alternate reality game—or an audio easter egg, the first task is usually enough. If you reveal readable letters, write down exactly what you can see before interpreting them. An ambiguous shape is an observation, not a solved clue.
Step-by-step: decoding visual easter eggs from WAV or MP3
Work on a copy and keep the supplied file unchanged. Prefer an original WAV when one is available, but do not discard an MP3 just because it is compressed. Changing its extension or saving it as WAV will not bring back information already lost during encoding.
- Open a spectrogram viewer. Choose the local audio file rather than making a microphone recording of playback.
- Generate an overview. Look for areas that appear deliberately geometric or contain repeated character-like strokes.
- Note the time. Record where the promising region starts and ends. A whole-song picture is useful for finding the region, not necessarily reading its finest details.
- Inspect that passage more closely. In an adjustable editor, zoom into time and enlarge the spectral track. Keep enough surrounding material to see the boundaries of the shape.
- Compare frequency scales. Try linear and logarithmic views. Keep a note of which makes the proportions clearer.
- Change one analysis setting at a time. Compare window size, frequency range, and display contrast rather than moving every control at once.
- Save your findings. Keep the original filename, passage time, viewer, settings, screenshot, and a literal transcription with uncertain letters marked.
If a result remains unclear, consider the file’s history. A recording made through speakers, a re-encoded upload, or an edited soundtrack may differ from the file a puzzle author intended. Ask for the original asset where appropriate instead of processing the audio to make it seem more convincing.
The audio-to-spectrogram guide covers the basic file-to-image workflow. For this task, the extra step is preserving settings and examining the particular passage that might contain the drawing.
Best settings for visual clarity (linear scale vs FFT window size)
Match the frequency scale to the drawing
A linear scale gives equal vertical space to equal frequency intervals. A logarithmic scale gives equal ratios equal space, spreading lower frequencies relative to higher ones. Neither is a universal decoder setting. A drawing created with one mapping can look stretched when you inspect it with the other.
Treat the first comparison as a display experiment: keep the same passage, switch the scale, and look at the whole outline. Do the strokes become more consistent? Does a circular shape stop looking squashed? Save both views if you are unsure. Do not force a word to fit by repeatedly changing the picture until it resembles your guess.
Balance frequency detail against time detail
FFT means fast Fourier transform, the calculation used to estimate frequencies in a slice of audio. The window size is the amount of audio used for that slice. A longer window can separate nearby tones more clearly, while making rapid changes less precise in time. A shorter window can separate quick strokes while leaving nearby frequency bands harder to distinguish.
In an editor that allows it, compare window sizes such as 1024, 2048, and 4096 as trial values, not a promised solution. If letters merge horizontally, inspect the shorter window. If vertically adjacent strokes merge, compare the longer one. Keep the time zoom unchanged while making that comparison so you know which setting produced the difference.
Audacity’s spectrogram settings expose the relevant controls. Change display settings rather than applying effects to the sound. Also distinguish a real increase in analysis-window length from zero padding: a denser-looking frequency grid does not automatically separate tones that the original window could not resolve.
Check range, contrast, and the source ceiling
A pattern can occupy only a small part of the available frequency range. Narrowing the displayed range can make it easier to inspect. Display gain and range can bring out faint features, but can also brighten background texture. Stop when more contrast makes the background as prominent as the candidate message.
A sample rate limits the frequencies a recording can represent. For example, a 44.1 kHz source has a 22.05 kHz upper limit. A viewer with a taller scale cannot invent information above that limit. This matters when a clue appears to be missing from the top of a picture.
Use this checklist when comparing views:
- Note the selected passage and scale before interpreting letters.
- Keep one screenshot before changing the next setting.
- Check each channel separately in an editor if a combined view is unclear.
- Separate a tentative outline from a confident transcription.
- Keep the original audio available for someone else to inspect.
Common examples in music, games, and ARG puzzles (Aphex Twin, Doom)
Aphex Twin: check the track, not just the release name
Christian Hill’s reproducible analysis of the Windowlicker EP shows a spiral near the end of the title track and a face in the separate track usually called “Formula.” His page includes the analysis code and resulting images. It also shows why the frequency mapping matters: a logarithmic frequency axis is used to display the images without the same distortion seen on a linear mapping.
That is a useful distinction when following an online clue. “The face in Windowlicker” may refer loosely to the EP rather than the title track. Confirm the exact track and version before searching the whole file. See Hill’s hidden-image walkthrough for the documented examples; this guide does not redistribute those recordings.
Doom: use a creator reference before comparing copies
For the Doom example, start with Mick Gordon’s DOOM: Behind the Music, Part 2, published on his official artist channel. It provides a creator reference for the soundtrack’s synthesis work, rather than an unattributed puzzle screenshot. Keep the soundtrack recording, a gameplay capture, and a fan upload separate when noting the version you inspect.
You do not need to assume a particular symbol or timestamp to begin. Record the passage and settings that show the candidate image in your own lawful copy, then compare them with the reference you are following. If they disagree, investigate the source and display mapping before claiming the message has disappeared.
ARG clues: record what the image actually shows
For a puzzle file, keep a short evidence note: file supplied, region inspected, settings tried, visible characters, and uncertain characters. If the shape is readable only after assuming the answer, preserve that uncertainty. The next puzzle step may require context outside the audio, and this guide does not attempt cipher solving.
Do not run cleanup first. Noise reduction, equalization, trimming, or other audio edits can change the strokes you are trying to examine. Keep an untouched copy even after you think you have read the message.
Free browser tools to inspect hidden spectrogram audio
dCode spectral analysis is a free browser option for inspecting audio frequencies and visual messages. Its documentation describes WAV and MP3 analysis and a logarithmic frequency display. Use the dCode spectral-analysis page when a clue mentions “dcode spectrogram.” Check a service’s current file-handling policy before choosing it for sensitive material; this guide makes no privacy promise for an external tool.
Sunofix’s free viewer offers a local first look at WAV or MP3 audio up to 100 MB and five minutes. It creates a 1920 × 840 PNG in the browser. Its analysis settings are fixed: it does not offer an editable FFT window or a linear/logarithmic switch. It does not recognize letters, solve puzzles, or decrypt messages. Fine detail and patterns that need a different frequency mapping may require another viewer.
Open the free Sunofix spectrogram viewer and inspect the downloaded image. If a full soundtrack exceeds the duration limit, use an editor to save a separate copy of the relevant passage, keeping the original and noting the crop’s offset. Do not describe a cropped file’s timestamp as if it were the original track time.
Audacity is the adjustable desktop fallback. Switch the track to Spectrogram view and use its Spectrogram Settings to compare scale, window, and frequency range. The standalone Plot Spectrum view is useful for a frequency snapshot, but it does not give the same time-frequency canvas needed to read a drawing across a passage.
How to make your own spectrogram text or image
A spectrogram text generator runs the process in the other direction: your drawing determines tones. Start with a simple high-contrast shape or a short word, rather than a detailed photograph. Use an image-to-audio tool with a documented frequency mapping. Image-Line’s Harmor documentation describes image resynthesis; this is a separate synthesis workflow, not a capability of the Sunofix viewer.
- Make an original image with thick strokes and generous spacing.
- Choose the duration and frequency mapping in the synthesis tool.
- Render an audio file and preserve that first render.
- Reopen it in a spectrogram viewer with a matching frequency scale.
- If the drawing is unclear, revise the source image or synthesis mapping and test again.
Listen at a comfortable volume: a visual pattern can produce sustained or piercing tones. Avoid making the pattern loud merely to make the screenshot brighter. If you mix it into music, inspect that combined render too, because the musical background may obscure your drawing.
A recognizable round trip is a practical test of your own message. It is not evidence that a screenshot can reproduce an arbitrary original recording exactly: phase, precise magnitudes, and display transformations matter.
Preserve the puzzle before processing the audio
I built Sunofix for the stage where the song already works but the exported audio still needs cleanup before mastering. That purpose is different from reading a hidden visual message. Keep the puzzle file untouched and finish your inspection before considering any processing.
I use spectrograms to place listening markers, not to grade a whole song by how smooth its colors look. The same restraint helps here: a strange picture is not automatically a sound-quality problem. If you later work on a music track with a repeatable audible defect, use the spectrogram-reading guide to connect the pattern to listening first.
I’m Mike Schwarz, founder of Sunofix and an AI music cleanup researcher. Sunofix’s commercial app is for comparing cleanup of audible music artifacts; it is not a hidden-message recovery service. For this page’s task, the free viewer and an adjustable editor are the useful next actions. Keep the untouched source, document your settings, and leave uncertain letters uncertain.
Continue listening
Related reading
FAQ
Spectrogram Decoder: How to Find and Read Hidden Messages in Audio FAQ
Can any audio player reveal hidden spectrogram images?
Only if it has a suitable spectrogram display. A playback button or waveform alone will not show the time-frequency picture. Use a browser spectrogram viewer first, then an editor with adjustable scale and analysis windows if the image is unclear.
Does MP3 compression destroy hidden spectrogram text?
It can remove or smear details, but it does not necessarily erase every message. The result depends on the original pattern and encoding. Inspect the best original file available. Converting an existing MP3 to WAV does not restore discarded information.
Can Sunofix decode the hidden text automatically?
No. The free generator creates a PNG for you to inspect visually. It does not recognize letters, solve puzzles, or decrypt messages. Its display settings are fixed, so faint or narrow patterns may need a different viewer.
Is a spectrogram text generator the same as a decoder?
No. A generator turns a drawing or text into tones; a viewer displays an existing audio file. Test a newly generated message by reopening the audio in a viewer, with the frequency mapping used to create it.
Can a spectrogram image recover the exact original audio?
A normal screenshot does not preserve all the information needed for exact reconstruction, including phase and precise numeric magnitudes. Image-to-audio tools synthesize or estimate sound from an image; they do not guarantee recovery of the original recording.